Install the app
How to install the app on iOS
Follow along with the video below to see how to install our site as a web app on your home screen.
Note: This feature currently requires accessing the site using the built-in Safari browser.
You are using an out of date browser. It may not display this or other websites correctly.
You should upgrade or use an alternative browser.
You should upgrade or use an alternative browser.
Silver Price Watch
- Thread starter STKR
- Start date
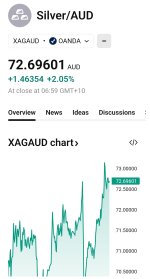
The surge in gold and silver has been impressive—gold is up over 46% year-to-date, trading around A$5,740 per ounce (using an AUD/USD rate of ~0.676, as of October 3, 2025), while silver’s climbed nearly 50% to about A$71 per ounce. This rally is driven by structural factors: persistent inflation, heavy central bank buying (especially from emerging markets), a weakening U.S. dollar against rising U.S. debt, and geopolitical tensions boosting safe-haven demand. Silver’s industrial demand—solar panels, EVs, electronics—adds extra fuel to this bull market, which still has room to run.
Long Forecast
A$78.49 (~USD $53.10)
Copper's riding the same electrification and supply crunch wave as silver, but with even more industrial torque—think EVs, renewables, data centers, and AI wiring gobbling up 1.2M+ tonnes by year-end. It's up a blistering 25% YTD to around US$5.03/lb (or A$7.44/lb at ~0.676 AUD/USD) as of October 3, 2025, hitting over A$14,800/tonne after Grasberg mine chaos in Indonesia wiped out 591,000 tonnes of supply through 2026.
mining.com
That's flipped the market from surplus to a 400,000-tonne deficit this year, per Benchmark Minerals, with central banks and green tech hoarding keeping the fire lit.
mining.com
Disruptions like floods and strikes are the spark, but the real fuel? China's grid spend (up 20% to $400B+), EV boom, and U.S. tariffs front-loading imports—500,000 tonnes/month vs. a 70,000 norm.
2024 Perth Mint Silver Dragon Rectangular Coin 1oz - Bullion Now
2024 Perth Mint Silver Dragon Rectangular Coin 1oz
Still, that's 786.2 for 10 dragons.
If I could put in a request?
Spot to stay static until the end of the year?
I would like to catch up a bit.... Plus I found some pieces I really would like to add to my stack for purely the joy of owning them
Spot to stay static until the end of the year?
I would like to catch up a bit.... Plus I found some pieces I really would like to add to my stack for purely the joy of owning them
If I could put in a request?
Spot to stay static until the end of the year?
I would like to catch up a bit.... Plus I found some pieces I really would like to add to my stack for purely the joy of owning them
I'll forward it to the commercial shorts... Although they seem to be having a hard time lately
It's funny how $20 was once cheap, then $50 was once cheap... $75 might be the new cheap in a few months.
So, so true!Once the mania truly starts, PMs will have waiting lists for delivery!
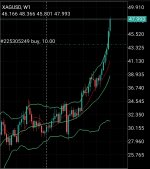
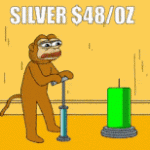
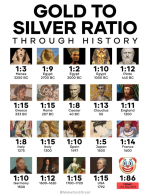
Been tracking this silver bull and it’s still warming up, not frothing yet. Spot’s at $48 USD/oz ($73 AUD) as of Oct 6—up 50% YTD from 2024 lows, smashing the 10-year high of $35, with the gold-silver ratio squeezing from 80:1 to 60:1 as silver starts outperforming.
If I could put in a request?
Spot to stay static until the end of the year?
...
No.


