Install the app
How to install the app on iOS
Follow along with the video below to see how to install our site as a web app on your home screen.
Note: This feature currently requires accessing the site using the built-in Safari browser.
You are using an out of date browser. It may not display this or other websites correctly.
You should upgrade or use an alternative browser.
You should upgrade or use an alternative browser.
Silver Price Watch
- Thread starter STKR
- Start date
painting the charts again on the spots
in the exchange for physical, there should not be much price differential with the bullion stores
it get better for lower prices on the kilo bars, further away from those exchanges
the same way those premium on silver eagles changes.
in the exchange for physical, there should not be much price differential with the bullion stores
it get better for lower prices on the kilo bars, further away from those exchanges
the same way those premium on silver eagles changes.
Silver needs to recover from here or we can expect a much larger correction on the monthly charts. We have almost 3 days worth of trading, so it's possible for it shoot up and test the $32.50 again. I dunno, I am rather optimistic for silver overall but it's a wait and see game at the moment. With projected deficits of 400 million Oz's this year, in no world do these markets make sense.
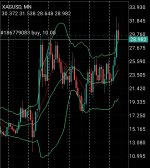

Friday night smack up? If we close the week above $30 then I think it's looking good for a solid run up to test $32.50 again next week. Of course, we then get a new monthly candle and it would likely go back into the $29's before shooting up. Fingers crossed 
Being a longterm lover of silver I have been Spying my way through the short, medium, and long-term charts for the metal a while now, and the way I see it with my knowledge of chart candles all 3 periods, are aligning to a major silver breakout very soon . I'm talking an all time hight to breakout for the PoS. There it's off my chestjust had to get it out.

It's setting up but this correction could go for a couple of months, and even see us go down to $26 before it makes it's move. A surge and close above $30.30 will be needed this week for me to be enthusiastic about a run in the short-term.
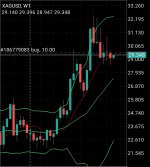
I'm anticipating a run up to 30ish, then possibly a smackdown to $27 levels if $30 doesn't hold. It could even go into $26, and that would be a great opportunity to acquire some physical because it could be the last time we see $26 silver ever again. I'm watching the charts like a hawk because I want to re-enter my position on First Majestic.
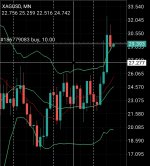
Last edited:
We need to break through this line. Lower highs and lower lows is a bad sign, and we can expect some selling pressure to show itself when we near $30. If we don't make a solid move above $30, I'm expecting a total beat down and the PoS to continue it's correction on the monthly charts. I re-entered my First Majestic position last night but I'll be monitoring and potentially closing it if silver shows signs of a reversal.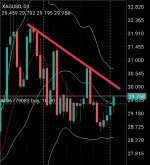
Nice little surge in FM shares but it may be short lived.
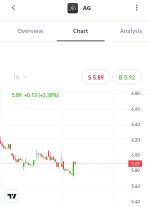

Nice little surge in FM shares but it may be short lived.

I think i would be more excited if i knew how to trade shares. As it stands, when silver is 35+ next thurs i would never part with physical so for me its a low stakes curiousity watching the price fluctuate. I guess that has emotional advantages, just no financial advantage!


