flower-shilling

Silver Price Watch

You can see the CFTC's Commitment of Traders (COT) report here:


Scroll down a little bit to find the Silver data. In the table, you can see the long and short positions for Swap dealers. I see 80,128 short and 27,804 long for a net short position of 52,324. Each contract represents 5,000 troy ounces, so the net short position is 261,620,000 troy ounces.

Thank you. I am aware of the COT reports, I was more referring to it being translated to the amount of $$ it made the shorts go underwater. It seems significant but it really isn't when you consider the trillions of dollars being printed (or even missing). This was a recent topic of interest to me because I recall all the claims of "buy silver, crash JPM" and the more recent arise of WallStreetBets and WSS. It would appear the paper markets weren't of any interest (except PSLV and others alike) and the physical market was where the real damage would be done.

When I first began looking at the COT reports and uncovering how the COMEX and CFTC operated, I realised that eventually the fundamentals would overwhelm the paper markets and it would all become irrelevant. That's why I've put more interest on the aboveground stockpiles side of things to try to gauge how long we have left. overall, I'm far more dedicated to understanding vaulting data than anything related to the paper markets but it is interesting to gauge market sentiment and get an insight to the desperation of the shorts as time progresses.
 
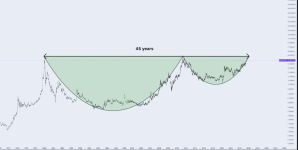
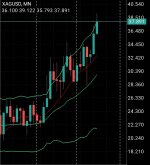
45 year cup and handle formation. We're nearly there boys.

Fail Old Man GIF


1752578409877.png
 
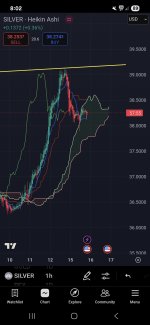
As previously discussed a pullback to 38 was inevitable and achieved. Now that pos is inside the cloud it gets interesting as Span A and Span B start to tighten! I hope they do not cross as 36.50 will come fast to the downside I want the Wall Street whores to burn with their shorts and silver upside to ATH ... we are close very close but critical timelines are now .

Screenshot_20250715_200205_TradingView.jpg
 
@Kooka30 this is the first time I've heard Andy speak about evidence (although anecdotal) of silver in a tomahawk cruise missile. As far as he's concerned there's 13-14kgs of confirmed silver in each one. It's actually not that crazy when you think about it. I've never looked up what a tomahawk cruise missile looks like and they're absolutely fkn massive. Essentially an unmanned jet aircraft with a serious business end.

View attachment 14424


View: https://youtu.be/de0H2zj4ixM?feature=shared

I was looking back for something & saw this post on the " Tomahawk "

I have read a number of articles over the las few yrs that speculate that the said Tomahawk Missiles have a Silver content of approx 15 Kg. Read up on the missiles construction & it's shear size. I don't find it implausible that a Tomahawk Missile has that much Silver content.

Given that Silver is the Best conductor of electricity & it's other properties, totally believable speculated Silver content.
 
China (SFE/SGE) seems to be holding the line. NYC/London appear to be trying to entertain Mr. Slammy.
 
USA wants a tariff war! China knows how to bleed Americans into submission. China has been trading for thousands of years and has the power to tell Trump to fark off.
 
I don't trust this rally if you can call it that.

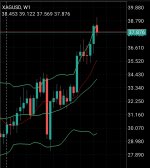
My instinct is another dump. View attachment 14439

Yes, I think the same. But a dump to where? $37.20 or beyond? $37 looks to be a good place for support. The weekly charts reveal potential for a rapid correction but I'm sceptical. What pisses me off is if we correct further there's absolutely no justification for it besides market intervention. It's the opposite of the plunge protection team - The Free-market rejection team. It also annoys me this is exactly what they want to achieve - frustrating market participants.
 
USA wants a tariff war! China knows how to bleed Americans into submission. China has been trading for thousands of years and has the power to tell Trump to fark off.
It must be so easy knowing leaders will change every few years. China has always played the long game. China will either be victorious or just move their goalposts to fight another day.
 
Yes, I think the same. But a dump to where? $37.20 or beyond? $37 looks to be a good place for support. The weekly charts reveal potential for a rapid correction but I'm sceptical. What pisses me off is if we correct further there's absolutely no justification for it besides market intervention. It's the opposite of the plunge protection team - The Free-market rejection team. It also annoys me this is exactly what they want to achieve - frustrating market participants.
Totally with u mate. Silver is in a 6 year structural supply deficit. How the fuck can the price be going DOWN !

This straight up price management.

But they have the money, so u have to work with it.
 
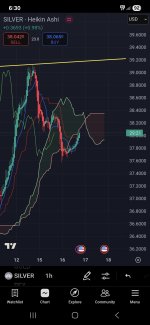
I have it for about $36.50 and if that fails 1 dollar below $35.50. I would like to say that any newbies who come to this site and don't know how the markets work or charts that this pullback is solid and a necessity for the next pos next leg up. To ATH.
 
I have it for about $36.50 and if that fails 1 dollar below $35.50. I would like to say that any newbies who come to this site and don't know how the markets work or charts that this pullback is solid and a necessity for the next pos next leg up. To ATH.

I mean sure, but usually the continuation of a strong uptrend isn't typically stopped in its tracks after two green candles. The weekly and monthly charts are all screaming this is just the beginning, but the daily and hourly say it can go any way. We're right at the cusp of Find Out after months of Fucking Around. Silver is such a retarded beast. $35 doesn't even look that stable if it decides to turn around and test that support. If we don't get a continuation of the trend in the next couple of weeks we really want it to trade sideways into the $36 realm or it could spell bad news. As we've seen time and time again in the past $5 dumps in a week is a common occurrence when they want to force their will.
Screenshot_2025-07-16-22-53-02-15_a068875e8d70110f8d1ec48729c67374.jpg


Screenshot_2025-07-16-22-55-17-35_a068875e8d70110f8d1ec48729c67374.jpg
 
Hmmm your candles are in overbought territory. I have proven that to you a few times already. Read them your way
My candles are 38 sideways as I have said. The rest well market rules
 
Hmmm your candles are in overbought territory. I have proven that to you a few times already. Read them your way
My candles are 38 sideways as I have said. The rest well market rules
RSI is good. They can trade outside the Bolinger bands without a reversal. It's just an indicator and that by itself isn't anything to go off. I'm not sure what you mean by "proven to you already". Every chart you share is Heikin Ashi, which comes with its own disadvantages.
 
^^^ Your charts are primitive to me. Sorry I do not want to be mean to hurt you in saying that I'm far from it.

They are literally live charts. Real-time price action and candles. And why would you think that would hurt me? Even Heikin Ashi is dependant on live charts. Every trader EVER utilises live charts. It's a weird thing to say.
 
Back
Top