Have Central Banks Lost Control Of The Gold Price?
Via GoldMoney.com,
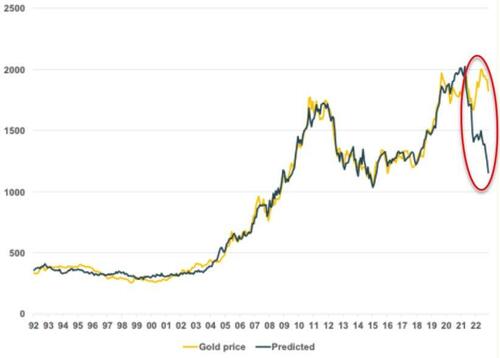
Over the past few months, gold prices have completely detached from our model-predicted prices.
While we have seen deviations between actual and predicted prices in the past, those deviations were always temporary.
What we are witnessing now is the paradigm shift we alluded to in our report from March 2023.
Some explanations for this deviation we presented in that report are still valid. However, it appears increasingly likely that the main reason for this development is the central banks’ having lost control over the gold price.
Exhibit 1: Gold prices have completely detached from model-predicted values
$/ozt
Source: Goldmoney Research
Earlier this year, we published a two-part report Gold prices reflect a shift in paradigm – Part I and Part II, (March 15 & 16, 2023) in which we explored the thesis that the gold market exhibits a permanent paradigm shift. Historically, gold prices followed three drivers: Real-interest rate expectations, longer-dated energy prices, and central bank policy (net gold sales and QE). In 2016 we presented a gold price model to our readers, which showed that most of the price changes in gold can be explained with these three drivers. Deviations of the observed price from the model were usually short lived and prices eventually converged with the underlying drivers. Readers unfamiliar with our model can catch up here (Gold Price Framework Vol. 2: The energy side of the equation, May 28, 2018, here (Part II, 10 July 2018) and here (Part III, 24 August 2018), as well as some follow up reports that built on the model (Gold Price Framework Update – the New Cycle Accelerates, 28 January 2021) and (Gold prices continue to weather the rate storm, 13 April, 2022.
When the Fed began to hike rates in late 2021 as a reaction to burgeoning inflation, gold prices did first what the model would predict: They began to decline. Rising interest rates usually lead to higher real interest rate expectations if long-term rates rise faster than long-term inflation expectations. Real-interest rate expectations (as measured by 10-year TIPS yields) are strongly inversely correlated with gold prices as shown in our model. In the past, gold prices often followed real interest rates almost tick-by-tick intraday without any other news.
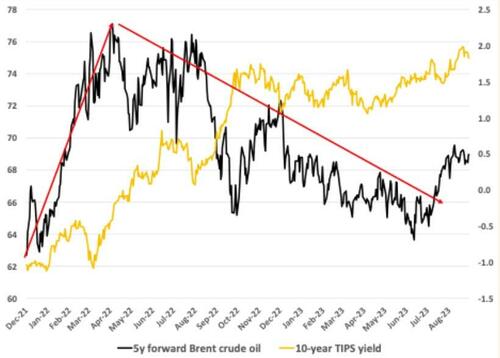
The decline in gold prices in early 2022 on the back of rising real-interest rate expectations was somewhat cushioned by rising energy prices. Long-dated oil prices rallied from $63.90/bbl in December 2021 to $75.91/bbl by July 2022. In our model, the rise in 10-year tips lowered predicted gold prices by $400/ozt while the rise in deferred oil prices increased it by $100/ozt (see Exhibit 2). On net, by August 2022, gold stood at $1737/ozt, just $25/ozt over our model predicted price of $1712.
Exhibit 2: The effect on gold by the rise in 10-year TIPS yields was initially offset by rising longer-dated oil prices
$/bbl (LHS), % (RHS)
Source: FRED, Goldmoney Research
However, while model-predicted prices continued to decline on the back of relentlessly rising real-interest rate expectations – and later the retracement of long-dated oil prices – gold prices turned and started to go up again. By fall 2022, we began noticing that, once again, gold prices had meaningfully deviated from predicted values. By the time we wrote our March 2023 note, gold traded already $450/ozt over the model predicted price, an absolute record at the time. Now the delta is a staggering $668/ozt. At the time of writing, gold is trading at $1870/ozt. But based on our model, it should be closer to $1202/ozt (see Exhibit 1). The chart illustrates clearly how detached gold prices have become from our model, and thus, the underlying drivers.
In our March 2023 note, we explored several theories that attempted to explain this large discrepancy between actual and predicted prices and we discussed whether we thought this was just a temporary phenomenon or whether this was something more permanent.
The first observation was that central banks of non-OECD countries have been on a massive buying spree from late summer 2022. In our March 2023 report, we highlighted that the IMFs estimate of net central bank purchases was way too low in our view. We highlighted that even the much more optimistic estimates by the World Gold Council might be too low. For our model, we are using the high end of estimates from the WGC, but if actual gold purchases were even higher, then our model-predicted price would be too low. In addition, we also explained why we think our model may underestimate the extent to which central bank purchases drive the price. Historically, changes in CB holding were relatively small, and often the reporting time did not match the actual purchase. Particularly non- OECD central banks have been very opaque when it comes to gold purchases. That means our econometric models cannot properly attribute changes in the gold price to changes in central bank gold holdings. We concluded that the true impact on the price of gold is likely larger than what our model predicts. Thus, in our March 2023 note we came to the conclusion that strong central bank gold purchases might partially explain why our model was underpredicting prices.
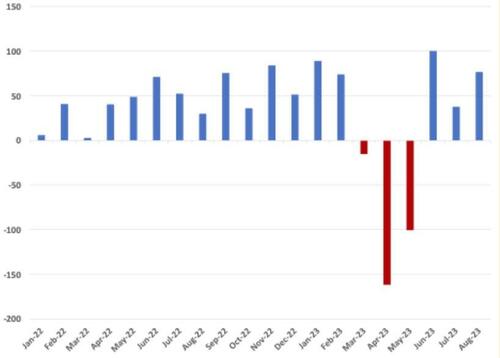
However, since then central banks became net sellers again. Data from the World Gold Council shows that central banks were large net gold sellers in March, April and May of this year, and only became net gold buyers again in June, July and August.
Exhibit 3: After a few months of large increases, central banks turned to net sellers in summer 2023 again
Tonnes month-over-month
Source: WGC, Goldmoney Research
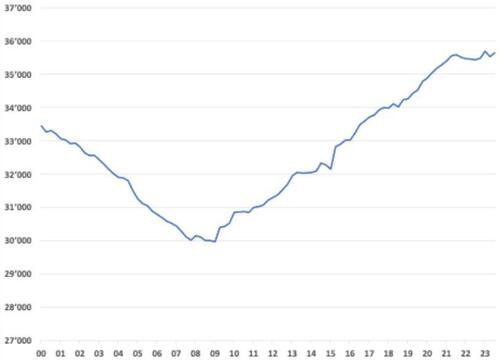
On net, central banks didn’t add more gold than normal so far in 2023. In fact, despite the strong rebound over the past few months, central banks added less gold in 2023 than on average since 2009. Hence, we can conclude that the large deviation of actual and model predicted gold prices was and is not due to abnormally high central bank gold purchases.
Exhibit 4: Central banks added less gold in 2023 than on average since 2009
Tonnes
Source: WGC, Goldmoney Research
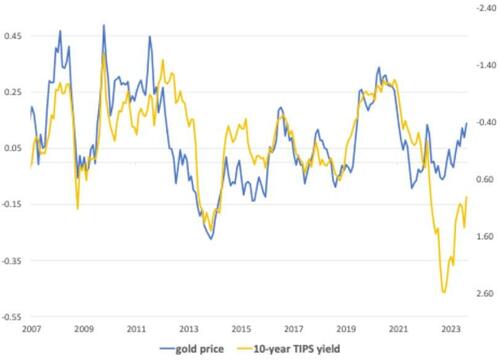
The second observation we made is that something seemed to have changed in the relationship between real-interest rate expectations and gold prices. The US has a very useful financial instrument to observe real-interest rate expectations: Treasury Inflation Protected Securities (TIPS). TIPS are government issued bonds that pay a fixed interest, similar to Treasuries. However, TIPS also compensate the holders for inflation as measured by the CPI. Thus, TIPS tend to carry a lower yield than treasuries of equivalent maturity. The difference between the nominal yield of a treasury note and the equivalent TIPS is therefore the market’s expectations for future inflation. We call this the breakeven inflation. TIPS yields themselves reflect real-interest rate expectations, meaning what the market thinks holders will earn in (real) interest until maturity, after inflation has been taken into account. Until very recently, gold and 10-year TIPS yields showed a remarkable inverse correlation over decades. However, since fall 2022, that relationship has broken down (see Exhibit 5).
Exhibit 5: The strong inverse correlation between TIPS yields and gold has broken down
% change gold price y-o-y (Log) (LHS), change in 10y TIPS yield % (RHS), inversed
Source: Goldmoney Research
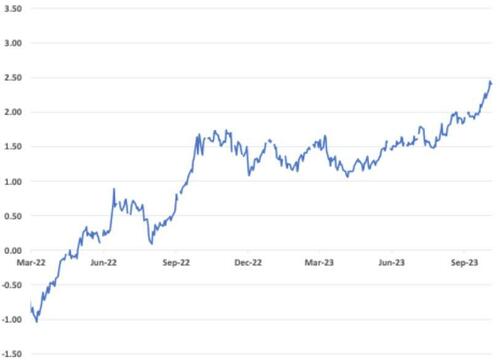
10-year TIPS yields rallied sharply since the Fed started raising rates, from -1.08% to currently 2.43%. That shift alone should have pushed gold price $600/ozt lower (see Exhibit 6).
Exhibit 6: 10-year TIPS yields moved over 3.5% higher in just 18 months
%
Source: FRED, Goldmoney Research
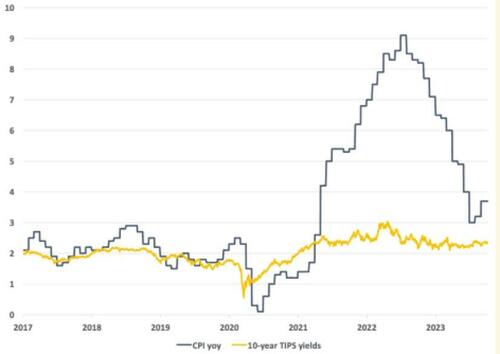
Arguably, there still are periods during which gold and real-interest rate move in lockstep, but for the past months, we observed long periods during which the inverse correlation between the two has completely broken down. Why is this? One can argue that the gold market is simply pricing in different inflation expectations than the TIPS market. One possible interpretation of the resilience of gold amidst rising real-interest rate expectations is that it is actually the TIPS market that is broken and not our model. While realized inflation jumped to 9% last year, implied breakeven inflation in TIPS yields barely moved above 3% and are already back to just shy of 2%, a level similar to years prior to the jump in inflation (see Exhibit 7).
Exhibit 7: 10-year TIPS breakeven inflation expectations remained low throughout the recent inflation spike
%
Source: FRED, Goldmoney Research
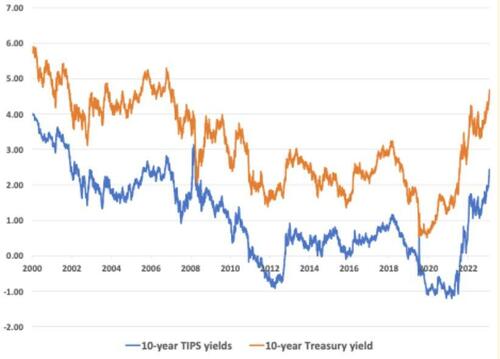
The absence of rising long-term breakeven inflation in the TIPS amidst relentlessly rising long-term interest rates have pushed 10-year TIPS yields to the highest level since 2008 (see Exhibit 8).
Exhibit 8: 10-year TIPS have reached levels not seen since 2008 on the back of rising nominal yields
%
Source: FRED, Goldmoney research
Inflation expectations would not have to be much higher than what is currently priced into TIPS yields to close the gap between observed and predicted gold prices. Assuming that “true” inflation expectations are 1% higher than what is embedded in 10-year TIPS yields, our model predicted gold prices would be around $1410/ozt. 2.5% higher inflation expectations close the gap almost entirely.
However, while we are sympathetic to the view that the gold market simply prices in higher (and in our view, more reasonable) longer-term inflation expectations than the TIPS market, this does still not explain why the correlation between changes in TIPS yields and gold prices seem to have completely broken-down multiple times since 2022. We, thus, present our readers with a third explanation. That is, we think western central banks have simply lost control over gold prices. What do we mean by that?
Despite abandoning the gold standard decades ago, gold prices still largely reflected central bank actions since then. Arguably western central banks so far were not primarily concerned about the price of gold in their respective currency, but they do try to control some of the factors that also drive gold prices. To illustrate this with the three main drivers for gold prices we identified in our model (Central bank net gold purchases/sales, real-interest rate expectations and longer dated energy prices):
In other words, markets understood that central banks and their policies were ultimately behind rising gold prices. But importantly, the market also believed that central banks had the power to reverse the impact of their policies and implicitly had the power to bring gold prices down. Our model shows that over the last 20+ years, sell-offs in gold prices were mainly due to falling longer-dated energy prices and / or rising real-interest rate expectations. The fact that the recent massive rally in real-interest rate expectations – which was entirely driven by central bank rate hikes – was just shrugged off by the gold market, suggests that the power of western central banks, and particularly the Fed, to implicitly control gold prices, has dramatically decreased, if not vanished.
To go one step further, the above interpretation may look at things the wrong way around. One can argue golds reluctance to react to the Fed rate hikes is just a symptom of a much larger issue. Rather than having lost control over gold prices, the Fed may have lost control over the US dollar itself. Gold priced in US dollars simply reflects that. And the Fed is not alone, all central banks are facing the same issue.
Gold has always been able to retain its purchasing power over the long run. But now it seems that gold is the only form of money left that retains value. All other monies are just wildly fluctuating against each other. It appears that gold is a better arbiter of value today than it has ever been since President Nixon suspended the gold standard in 1971.
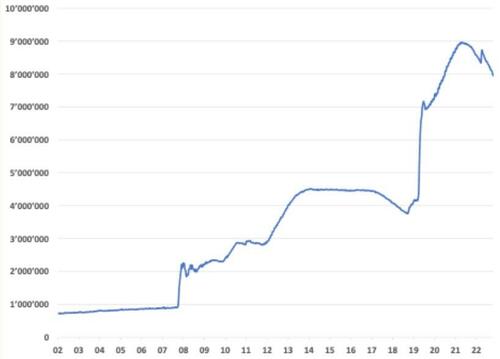
Can the fed regain control over gold prices? The sharp rise in US interest rates by the Fed may have temporarily slowed price inflation as reported in the CPI. We think there is a high chance that the sudden rise in interest rates will cause a global recession in the near term, which in turn could even lead to temporary deflation as commodity demand collapses. But all the monetary policy that preceded the recent rise in inflation has not been undone and as a result, neither have all the excesses in the financial markets. For example, while the Fed funds rate went from zero to 5.5%, the Fed only unwound a fraction of its assets, from $9 trillion to $8 trillion (see Exhibit 9). Since the start of QT, the Fed has reduced its balance sheet by roughly $13bn per week. At this pace, it would take until 2029 to bring back the Feds balance sheet to just pre-pandemic levels, and until 2034 to bring it back to pre-financial crisis levels.
Exhibit 9: Amidst massively tighter financial conditions, the Feds balance sheet has barely moved lower
$ millions
Source: FRED, Goldmoney Research
It is extremely unlikely in our view that we will see significantly more QT until the next crisis forces the Fed to reverse course. More and more people are recognizing that gold is a neutral anchor in an increasingly fragile currency world.
They chose to move more of their wealth in gold simply because the uncertainty of currency value remains extremely high even as observed inflation has come off substantially.
In our past reports about this topic, we concluded that the reasons why gold prices deviate from their historical drivers may well be permanent, but there is also a risk that the impending recession will crush that gap as inflation turns to deflation, real-interest rate expectations jump and investors seek refuge in the $ rather than gold, as they have done before, most notably in the early days of the great financial crisis in 2008/2009. While we still think that a sharp recession can put downward pressure on gold prices, we no longer think that the gap between observed prices and model predicted prices will close. The drivers behind the deviation are permanent in our view. Foreign central banks will most likely continue increasing their gold holdings.
“True” inflation expectations will remain high, and probably rise sharply when the Fed and other western central banks will inevitably return to ZIRP and NIRP and aggressively pursue QE. This will further undermine the Feds and other central banks ability to control the exchange rate between gold and their respective currencies.
Tyler Durden Tue, 10/17/2023 - 15:40
Continue reading...
Via GoldMoney.com,
Over the past few months, gold prices have completely detached from our model-predicted prices.
While we have seen deviations between actual and predicted prices in the past, those deviations were always temporary.
What we are witnessing now is the paradigm shift we alluded to in our report from March 2023.
Some explanations for this deviation we presented in that report are still valid. However, it appears increasingly likely that the main reason for this development is the central banks’ having lost control over the gold price.
Exhibit 1: Gold prices have completely detached from model-predicted values
$/ozt

Source: Goldmoney Research
Earlier this year, we published a two-part report Gold prices reflect a shift in paradigm – Part I and Part II, (March 15 & 16, 2023) in which we explored the thesis that the gold market exhibits a permanent paradigm shift. Historically, gold prices followed three drivers: Real-interest rate expectations, longer-dated energy prices, and central bank policy (net gold sales and QE). In 2016 we presented a gold price model to our readers, which showed that most of the price changes in gold can be explained with these three drivers. Deviations of the observed price from the model were usually short lived and prices eventually converged with the underlying drivers. Readers unfamiliar with our model can catch up here (Gold Price Framework Vol. 2: The energy side of the equation, May 28, 2018, here (Part II, 10 July 2018) and here (Part III, 24 August 2018), as well as some follow up reports that built on the model (Gold Price Framework Update – the New Cycle Accelerates, 28 January 2021) and (Gold prices continue to weather the rate storm, 13 April, 2022.
When the Fed began to hike rates in late 2021 as a reaction to burgeoning inflation, gold prices did first what the model would predict: They began to decline. Rising interest rates usually lead to higher real interest rate expectations if long-term rates rise faster than long-term inflation expectations. Real-interest rate expectations (as measured by 10-year TIPS yields) are strongly inversely correlated with gold prices as shown in our model. In the past, gold prices often followed real interest rates almost tick-by-tick intraday without any other news.
The decline in gold prices in early 2022 on the back of rising real-interest rate expectations was somewhat cushioned by rising energy prices. Long-dated oil prices rallied from $63.90/bbl in December 2021 to $75.91/bbl by July 2022. In our model, the rise in 10-year tips lowered predicted gold prices by $400/ozt while the rise in deferred oil prices increased it by $100/ozt (see Exhibit 2). On net, by August 2022, gold stood at $1737/ozt, just $25/ozt over our model predicted price of $1712.
Exhibit 2: The effect on gold by the rise in 10-year TIPS yields was initially offset by rising longer-dated oil prices
$/bbl (LHS), % (RHS)

Source: FRED, Goldmoney Research
However, while model-predicted prices continued to decline on the back of relentlessly rising real-interest rate expectations – and later the retracement of long-dated oil prices – gold prices turned and started to go up again. By fall 2022, we began noticing that, once again, gold prices had meaningfully deviated from predicted values. By the time we wrote our March 2023 note, gold traded already $450/ozt over the model predicted price, an absolute record at the time. Now the delta is a staggering $668/ozt. At the time of writing, gold is trading at $1870/ozt. But based on our model, it should be closer to $1202/ozt (see Exhibit 1). The chart illustrates clearly how detached gold prices have become from our model, and thus, the underlying drivers.
In our March 2023 note, we explored several theories that attempted to explain this large discrepancy between actual and predicted prices and we discussed whether we thought this was just a temporary phenomenon or whether this was something more permanent.
The first observation was that central banks of non-OECD countries have been on a massive buying spree from late summer 2022. In our March 2023 report, we highlighted that the IMFs estimate of net central bank purchases was way too low in our view. We highlighted that even the much more optimistic estimates by the World Gold Council might be too low. For our model, we are using the high end of estimates from the WGC, but if actual gold purchases were even higher, then our model-predicted price would be too low. In addition, we also explained why we think our model may underestimate the extent to which central bank purchases drive the price. Historically, changes in CB holding were relatively small, and often the reporting time did not match the actual purchase. Particularly non- OECD central banks have been very opaque when it comes to gold purchases. That means our econometric models cannot properly attribute changes in the gold price to changes in central bank gold holdings. We concluded that the true impact on the price of gold is likely larger than what our model predicts. Thus, in our March 2023 note we came to the conclusion that strong central bank gold purchases might partially explain why our model was underpredicting prices.
However, since then central banks became net sellers again. Data from the World Gold Council shows that central banks were large net gold sellers in March, April and May of this year, and only became net gold buyers again in June, July and August.
Exhibit 3: After a few months of large increases, central banks turned to net sellers in summer 2023 again
Tonnes month-over-month

Source: WGC, Goldmoney Research
On net, central banks didn’t add more gold than normal so far in 2023. In fact, despite the strong rebound over the past few months, central banks added less gold in 2023 than on average since 2009. Hence, we can conclude that the large deviation of actual and model predicted gold prices was and is not due to abnormally high central bank gold purchases.
Exhibit 4: Central banks added less gold in 2023 than on average since 2009
Tonnes

Source: WGC, Goldmoney Research
The second observation we made is that something seemed to have changed in the relationship between real-interest rate expectations and gold prices. The US has a very useful financial instrument to observe real-interest rate expectations: Treasury Inflation Protected Securities (TIPS). TIPS are government issued bonds that pay a fixed interest, similar to Treasuries. However, TIPS also compensate the holders for inflation as measured by the CPI. Thus, TIPS tend to carry a lower yield than treasuries of equivalent maturity. The difference between the nominal yield of a treasury note and the equivalent TIPS is therefore the market’s expectations for future inflation. We call this the breakeven inflation. TIPS yields themselves reflect real-interest rate expectations, meaning what the market thinks holders will earn in (real) interest until maturity, after inflation has been taken into account. Until very recently, gold and 10-year TIPS yields showed a remarkable inverse correlation over decades. However, since fall 2022, that relationship has broken down (see Exhibit 5).
Exhibit 5: The strong inverse correlation between TIPS yields and gold has broken down
% change gold price y-o-y (Log) (LHS), change in 10y TIPS yield % (RHS), inversed

Source: Goldmoney Research
10-year TIPS yields rallied sharply since the Fed started raising rates, from -1.08% to currently 2.43%. That shift alone should have pushed gold price $600/ozt lower (see Exhibit 6).
Exhibit 6: 10-year TIPS yields moved over 3.5% higher in just 18 months
%

Source: FRED, Goldmoney Research
Arguably, there still are periods during which gold and real-interest rate move in lockstep, but for the past months, we observed long periods during which the inverse correlation between the two has completely broken down. Why is this? One can argue that the gold market is simply pricing in different inflation expectations than the TIPS market. One possible interpretation of the resilience of gold amidst rising real-interest rate expectations is that it is actually the TIPS market that is broken and not our model. While realized inflation jumped to 9% last year, implied breakeven inflation in TIPS yields barely moved above 3% and are already back to just shy of 2%, a level similar to years prior to the jump in inflation (see Exhibit 7).
Exhibit 7: 10-year TIPS breakeven inflation expectations remained low throughout the recent inflation spike
%

Source: FRED, Goldmoney Research
The absence of rising long-term breakeven inflation in the TIPS amidst relentlessly rising long-term interest rates have pushed 10-year TIPS yields to the highest level since 2008 (see Exhibit 8).
Exhibit 8: 10-year TIPS have reached levels not seen since 2008 on the back of rising nominal yields
%

Source: FRED, Goldmoney research
Inflation expectations would not have to be much higher than what is currently priced into TIPS yields to close the gap between observed and predicted gold prices. Assuming that “true” inflation expectations are 1% higher than what is embedded in 10-year TIPS yields, our model predicted gold prices would be around $1410/ozt. 2.5% higher inflation expectations close the gap almost entirely.
However, while we are sympathetic to the view that the gold market simply prices in higher (and in our view, more reasonable) longer-term inflation expectations than the TIPS market, this does still not explain why the correlation between changes in TIPS yields and gold prices seem to have completely broken-down multiple times since 2022. We, thus, present our readers with a third explanation. That is, we think western central banks have simply lost control over gold prices. What do we mean by that?
Despite abandoning the gold standard decades ago, gold prices still largely reflected central bank actions since then. Arguably western central banks so far were not primarily concerned about the price of gold in their respective currency, but they do try to control some of the factors that also drive gold prices. To illustrate this with the three main drivers for gold prices we identified in our model (Central bank net gold purchases/sales, real-interest rate expectations and longer dated energy prices):
Until recently, it was mainly western central banks that bought and sold large quantities of gold (mostly sold).
Central banks set interest rates, which impacted real-interest rates expectations. Central banks also control how much money is in circulation, which impacted inflation and inflation expectations. QE was just another form of manipulating interest rates (and we argue it is behind the surge in inflation).
On a long enough timeline, longer dated energy prices reflect mostly inflation.
In other words, markets understood that central banks and their policies were ultimately behind rising gold prices. But importantly, the market also believed that central banks had the power to reverse the impact of their policies and implicitly had the power to bring gold prices down. Our model shows that over the last 20+ years, sell-offs in gold prices were mainly due to falling longer-dated energy prices and / or rising real-interest rate expectations. The fact that the recent massive rally in real-interest rate expectations – which was entirely driven by central bank rate hikes – was just shrugged off by the gold market, suggests that the power of western central banks, and particularly the Fed, to implicitly control gold prices, has dramatically decreased, if not vanished.
To go one step further, the above interpretation may look at things the wrong way around. One can argue golds reluctance to react to the Fed rate hikes is just a symptom of a much larger issue. Rather than having lost control over gold prices, the Fed may have lost control over the US dollar itself. Gold priced in US dollars simply reflects that. And the Fed is not alone, all central banks are facing the same issue.
Gold has always been able to retain its purchasing power over the long run. But now it seems that gold is the only form of money left that retains value. All other monies are just wildly fluctuating against each other. It appears that gold is a better arbiter of value today than it has ever been since President Nixon suspended the gold standard in 1971.
Can the fed regain control over gold prices? The sharp rise in US interest rates by the Fed may have temporarily slowed price inflation as reported in the CPI. We think there is a high chance that the sudden rise in interest rates will cause a global recession in the near term, which in turn could even lead to temporary deflation as commodity demand collapses. But all the monetary policy that preceded the recent rise in inflation has not been undone and as a result, neither have all the excesses in the financial markets. For example, while the Fed funds rate went from zero to 5.5%, the Fed only unwound a fraction of its assets, from $9 trillion to $8 trillion (see Exhibit 9). Since the start of QT, the Fed has reduced its balance sheet by roughly $13bn per week. At this pace, it would take until 2029 to bring back the Feds balance sheet to just pre-pandemic levels, and until 2034 to bring it back to pre-financial crisis levels.
Exhibit 9: Amidst massively tighter financial conditions, the Feds balance sheet has barely moved lower
$ millions

Source: FRED, Goldmoney Research
It is extremely unlikely in our view that we will see significantly more QT until the next crisis forces the Fed to reverse course. More and more people are recognizing that gold is a neutral anchor in an increasingly fragile currency world.
They chose to move more of their wealth in gold simply because the uncertainty of currency value remains extremely high even as observed inflation has come off substantially.
In our past reports about this topic, we concluded that the reasons why gold prices deviate from their historical drivers may well be permanent, but there is also a risk that the impending recession will crush that gap as inflation turns to deflation, real-interest rate expectations jump and investors seek refuge in the $ rather than gold, as they have done before, most notably in the early days of the great financial crisis in 2008/2009. While we still think that a sharp recession can put downward pressure on gold prices, we no longer think that the gap between observed prices and model predicted prices will close. The drivers behind the deviation are permanent in our view. Foreign central banks will most likely continue increasing their gold holdings.
“True” inflation expectations will remain high, and probably rise sharply when the Fed and other western central banks will inevitably return to ZIRP and NIRP and aggressively pursue QE. This will further undermine the Feds and other central banks ability to control the exchange rate between gold and their respective currencies.
Tyler Durden Tue, 10/17/2023 - 15:40
Continue reading...

