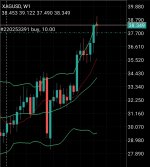
Ok, up until now i have always been interested only in spot price in general terms and never subscribed to any trading chart service. Yes..i could spend some time going back through these threads and figure it out but what are some suggestions for something i can look at just on a laptop, not my phone. Ideally something with a free trial phase or version as i have no interest in trading until maybe another few years of looking and learning.
Install the app
How to install the app on iOS
Follow along with the video below to see how to install our site as a web app on your home screen.
Note: This feature currently requires accessing the site using the built-in Safari browser.
You are using an out of date browser. It may not display this or other websites correctly.
You should upgrade or use an alternative browser.
You should upgrade or use an alternative browser.
Silver Price Watch
- Thread starter STKR
- Start date
I use metaTrader 4 (MT4) on both phone and PC. You can create a demo account for free and trade until the cows come home. Learning how to use it is a process in itself but it's not overly complex.Ok, up until now i have always been interested only in spot price in general terms and never subscribed to any trading chart service. Yes..i could spend some time going back through these threads and figure it out but what are some suggestions for something i can look at just on a laptop, not my phone. Ideally something with a free trial phase or version as i have no interest in trading until maybe another few years of looking and learning.
There's other options like webtrader and TradingView but MT4 is what I've used from day 1, so I stick with it.
Ok sweet thanks for sharing i will check it out.
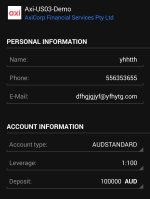
This video is a good place to start with MT4 if you choose this path. I use AxiTrader as my broker. I can help you setup a demo through them. This video will also be helpful:
View: https://youtu.be/qhY79w8bRws?feature=shared
Yeah. You should use AxiTrader as your brokerI watch that video , cos my demo account seems to only have foreign exchange rates available and no commodities.
Code AXI and select the US03 one. It will show you commodities
Golds on a tear with all that global terror they do so well, silver might hit 39 for the weekend!
That's where I thought it was going by week close. High 38 or low to mid 39. The market is encountering a lot of resistance though. Very slow moving on the upside.
Before you get bombarded with shit, just get your demo up and running. Plenty of guides out there on how to read candle charts:

 stockstotrade.com
The MMA's being referenced is (modified) Moving Average. It's good to understand moving averages in general.
:max_bytes(150000):strip_icc()/MOVING-AVERAGE-FINAL-21674874615f49c19444bbd9d2086c51.jpg)
 www.investopedia.com
The good thing about the internet is there's no shortage of people offering their knowledge (and opinions). There are countless trading guides available on YouTube and online. These will allow you to learn at your own pace anytime and put everything into practice immediately.

A Candlestick Chart Defined: How to Interpret Them
Read this article because it delves into the intricacies of candlestick charts, a vital tool for traders in markets like forex, crypto, and equities.
The MMA's being referenced is (modified) Moving Average. It's good to understand moving averages in general.
:max_bytes(150000):strip_icc()/MOVING-AVERAGE-FINAL-21674874615f49c19444bbd9d2086c51.jpg)
Moving Average (MA): Purpose, Uses, Formula, and Examples
Learn what a moving average (MA) is, how it’s calculated, and how traders use it to identify trends, smooth price data, and guide trading decisions.
The good thing about the internet is there's no shortage of people offering their knowledge (and opinions). There are countless trading guides available on YouTube and online. These will allow you to learn at your own pace anytime and put everything into practice immediately.
It's a demo accountSo many people open a demo account and get washed away in seconds. Learn the basics of how the markets work study every noke and crannies before you even enter into your first trade. One must understand what they are looking at
Just open a demo and learn as you go. That way it's immediately relevant and you can test your newly found knowledge.
Last edited:
" Opinions on the Internet "cascade in what seems like the hall of mirrors effect.Before you get bombarded with shit, just get your demo up and running. Plenty of guides out there on how to read candle charts:

A Candlestick Chart Defined: How to Interpret Them
Read this article because it delves into the intricacies of candlestick charts, a vital tool for traders in markets like forex, crypto, and equities.stockstotrade.com
The MMA's being referenced is (modified) Moving Average. It's good to understand moving averages in general.
:max_bytes(150000):strip_icc()/MOVING-AVERAGE-FINAL-21674874615f49c19444bbd9d2086c51.jpg)
Moving Average (MA): Purpose, Uses, Formula, and Examples
Learn what a moving average (MA) is, how it’s calculated, and how traders use it to identify trends, smooth price data, and guide trading decisions.www.investopedia.com
The good thing about the internet is there's no shortage of people offering their knowledge (and opinions). There are countless trading guides available on YouTube and online. These will allow you to learn at your own pace anytime and put everything into practice immediately.
Some 1 posts an opinion & then some 1 will post their opinion of the said posted opinion. This the generates an opinion about the posted opinion of the 1'st said opinion & then on & on & on & on ..........
It's easy to get lost in this reflection of opinions of opinions & to loose sight of what the original opinion was opining about
When I think of this words from a song pop into my head -
" clowns to the left of me, jokers to the right, here I am, stuck in the middle with u "
Some Opinions maybe best kept to one's self, but that's just my opinion
Mate, personally I like & appreciate that u post a chart/s with the comment/s u are making.If anyone wants to ask a question about charts please feel free to ask. I'm not God but know heavenly stuff. I also don't personally attack anyone on here i never have done or will if you know fuckall about them
1 thing though. Is it possible to annotate ur charts to define the specific part of the chart u are commenting on ?
I haven't use Trading View, so I'm not sure if that's possible. Would provide a bit more clarity on some of the points u are making.
That is by far the best analogy of it all.When I think of this words from a song pop into my head -
" clowns to the left of me, jokers to the right, here I am, stuck in the middle with u "
You know what's funny though. When it comes to reading charts, it represents patterns in human psychology. Psychology of fear and greed.
That's it 100% mate. They are just a chart/visual representation the human psychology of FEAR & GREEDThat is by far the best analogy of it all.
You know what's funny though. When it comes to reading charts, it represents patterns in human psychology. Psychology of fear and greed.
Yeah havent yet had time to implement anything but will pull out the old (not so old but awesome, thanks ozcopper) laptop tonight.
Sweet. It's probably worth creating a seperate "trading" thread, so all the info is in one place.


